How can 100 years of digitised rainfall data help you? Learn more.
The British Rainfall Digital Archive (BRDA) was compiled in 2007-8 by Hydro-GIS Ltd as part of the NERC project with Oxford University – ‘Quantifying Flood Risk of Extreme Events using Density Forecasts based on a New Digital Archive and Weather Ensemble Predictions’. The BRDA is the most comprehensive resource on historical extreme rainfall in the UK, including:
- Over 28,000 observations of extreme rainfall back to the year 1866.
- Over 1000 pages of text and eye-witness accounts describing the rainfall events and associated impacts such as flooding.
- Over 250 rainfall maps and photographs.
Dr Harvey Rodda, Hydro-GIS CEO said: “The British Rainfall Digital Archive is the most comprehensive source of historical rainfall event information in the British Isles for observations prior to the official digital monitoring record started by the Met Office in 1961. Having the most extreme events from this archive as rainfall footprints in a grid-based format provides a data source which is ideally suited for flood risk analysis such as scenario testing, catastrophe model validation, and identifying trends of extreme events."
For Oasis HUB, the rainfall maps have been digitised and made available as raster data to provide the rainfall depths and extents in a useable format for further research and analysis.
The maps and its application
The maps have been extracted from the most comprehensive archive of historical rainfall in the UK and show the total rainfall that was observed for the most extreme events to have affected the British Isles over the period 1866-1968.
The maps are provided both as the original hand-drafted isohyet map in digital format, and in raster format as 5km grid-cell resolution ascii files interpolated from the original isohyets. The raster format provides data which can be readily used for further modelling and analysis.
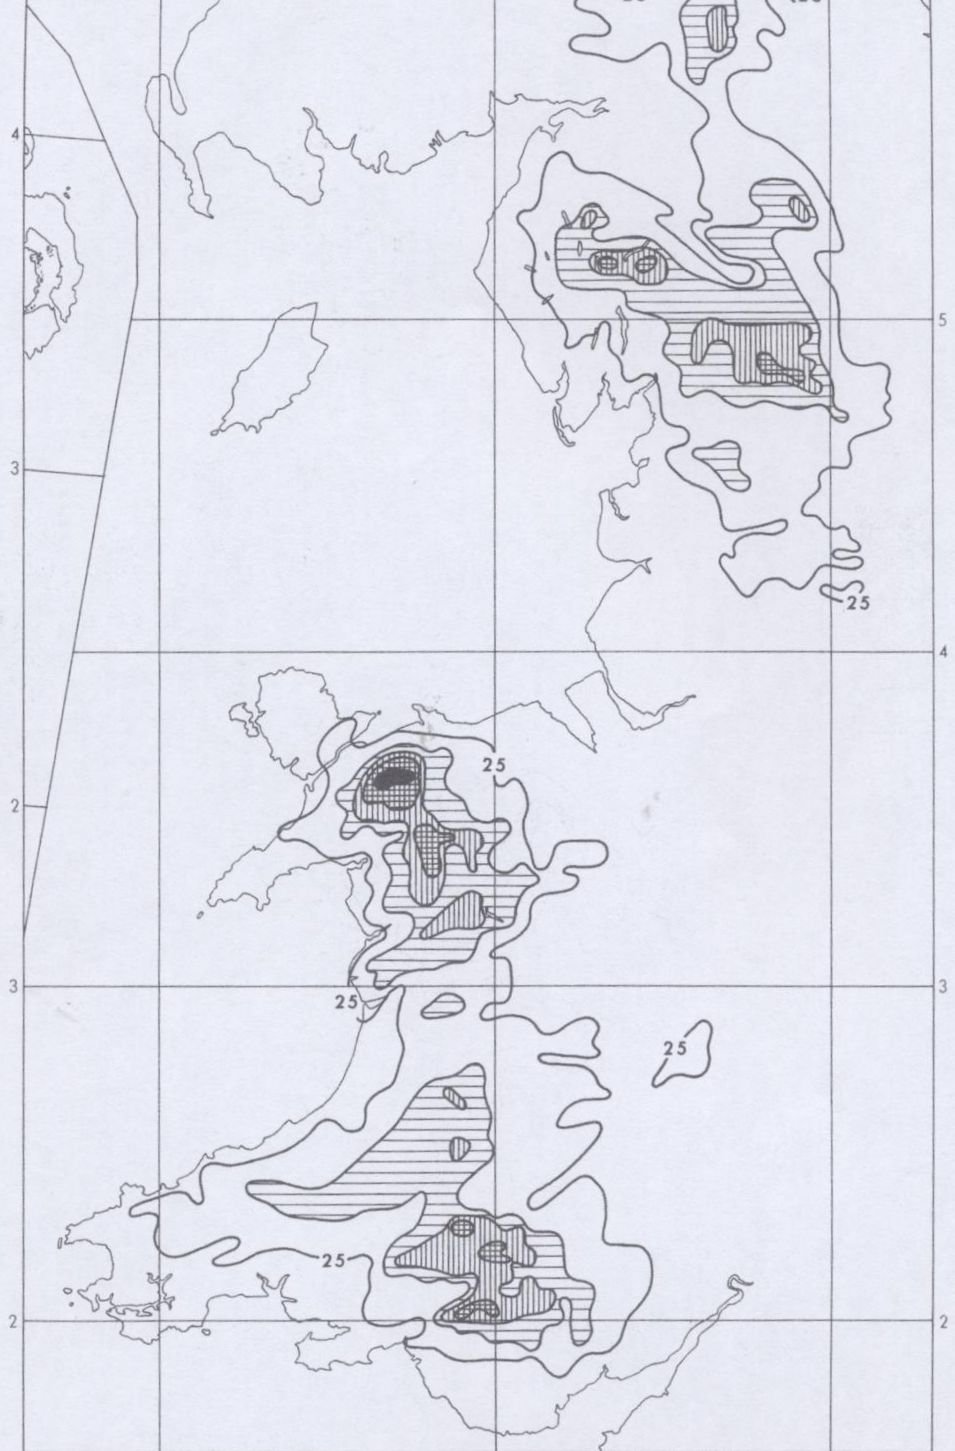
Isohyet map in digital format from 23rd March 1968
The primary application for this data in flood catastrophe modelling will be as a set of event footprints for either the development of a cat model or the review and validation of existing event-based cat models. The data provides real-world examples of events over a 102-year period to give a measure of the frequency, location and magnitude of rainfall. Existing UK cat models which have generated stochastic flood events from rainfall can be tested to examine if their scenarios include the characteristic events which have been observed in the past and could be observed in the future with potential greater magnitude given the effects of climate change.
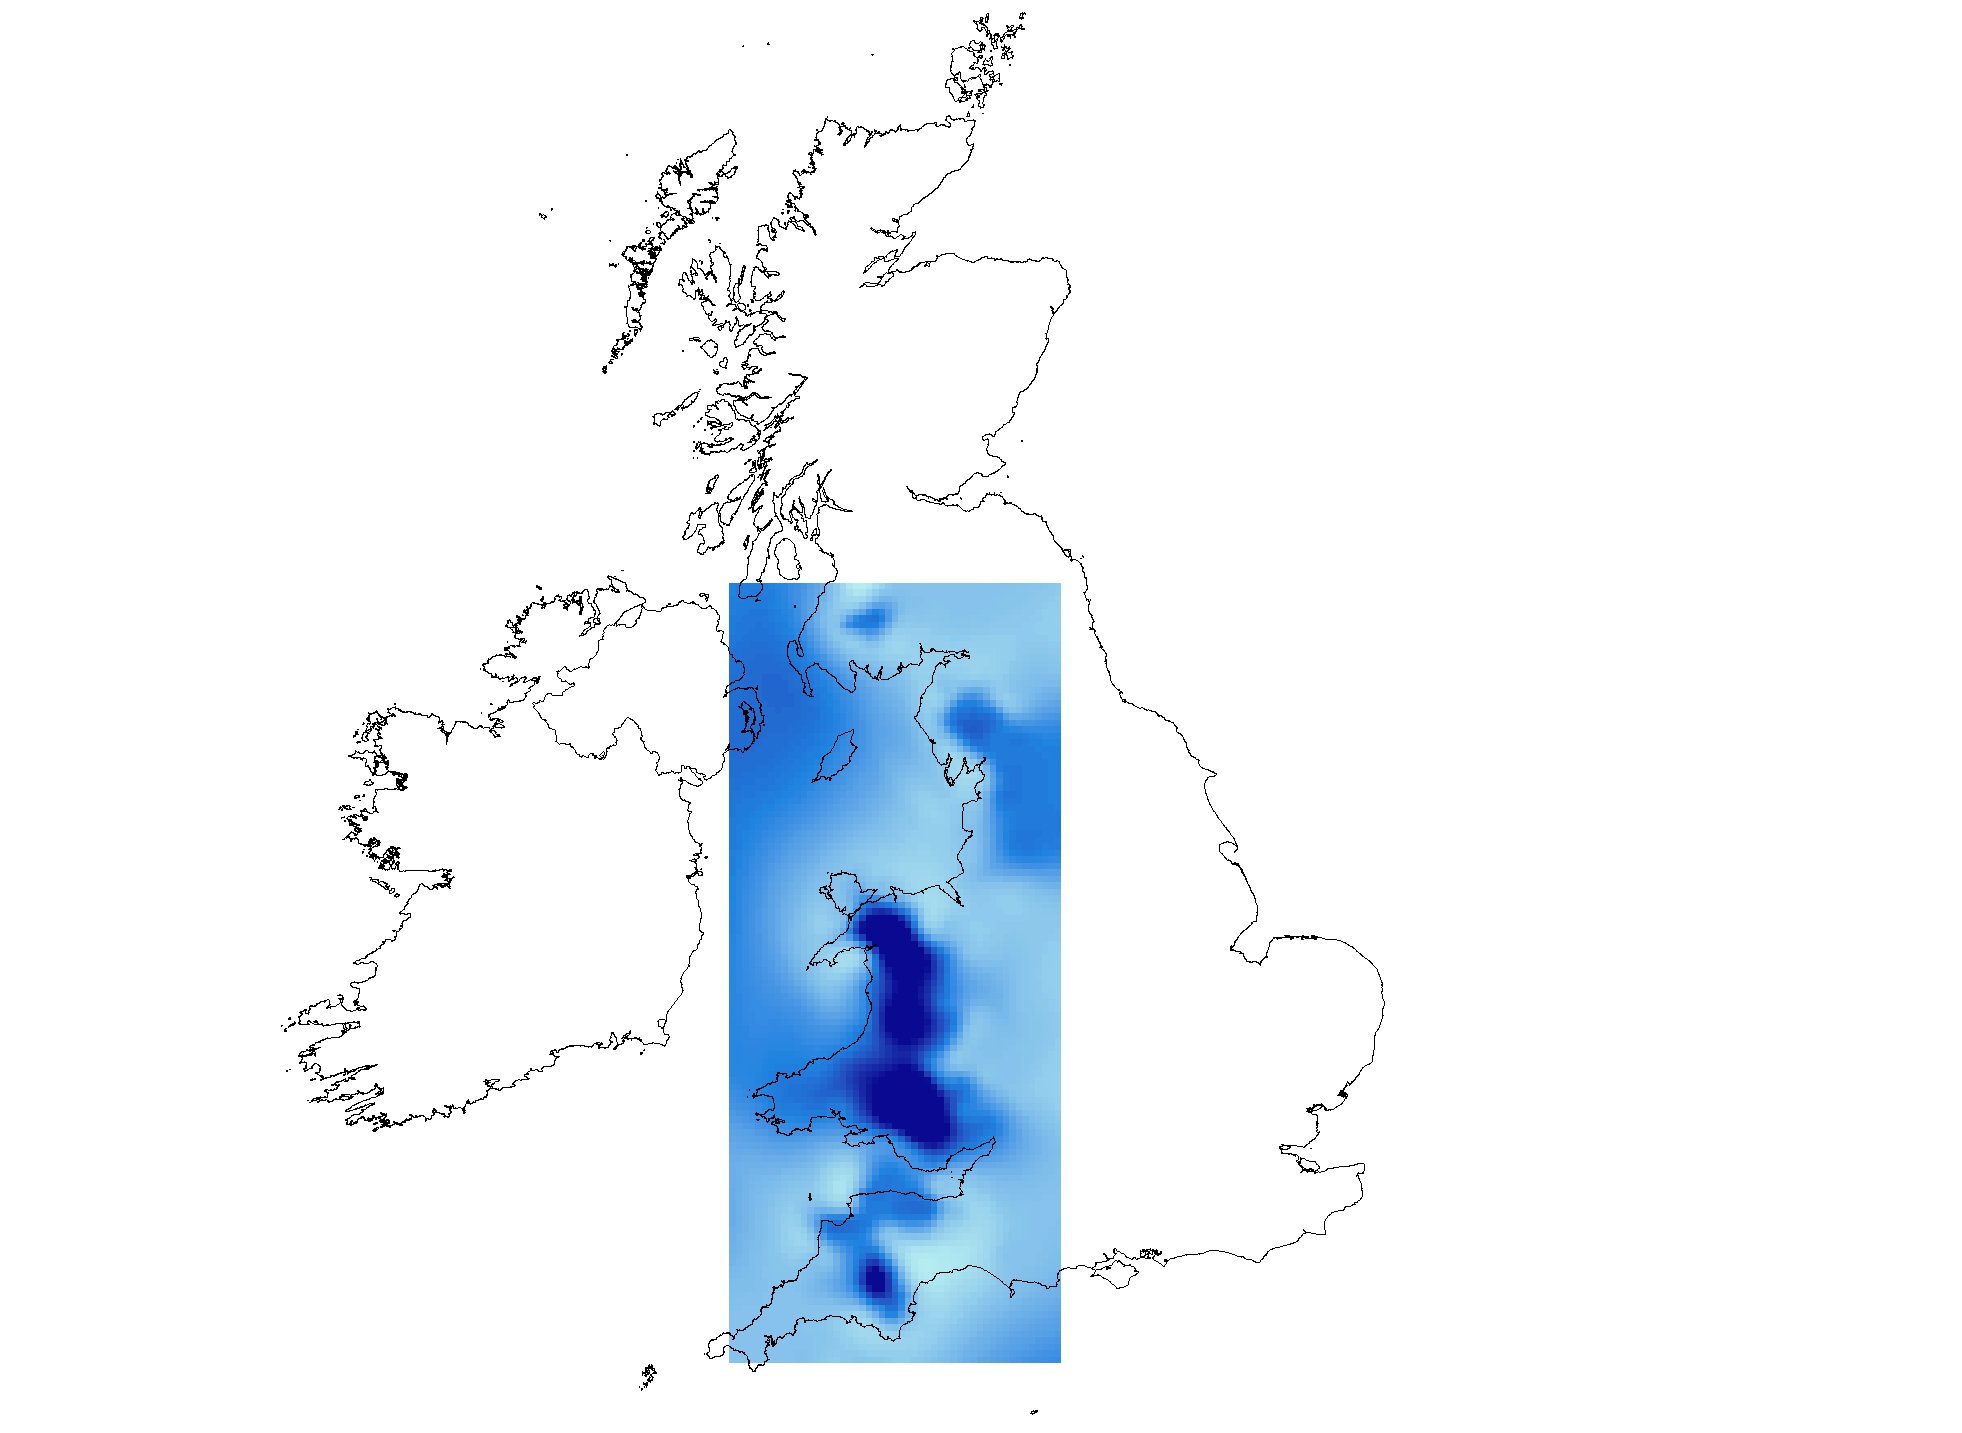
Raster format with 5km grid-cell resolution
The data can also be used in a scenario-testing mode to run cat-model scenarios for specific areas to answer the what if questions, for example what would be the impact if particular historical floods were to happen with current land-use and building stock. The scenario testing can be used in other applications outside of cat-modelling such as providing scenarios for emergency management, testing hydrological rainfall-runoff models, and assessing potential impacts of climate change in terms of frequency and magnitude of extreme events. This will be of interest to researchers, consultants, local authorities, and government organisations.
Watch the webinar recording
Download the slides
You can download a copy of the slides in PDF format by clicking this link.